Risk-sensitive assets were broadly higher this past session, but the Dow paced them all with an 11.3% rally - its biggest since 1933
Against
the backdrop of an unmistakably troubled growth forecast through PMIs,
hope was fostered in particular by US stimulus expectations
Volatility
remains the leading consideration for the broader markets with sudden
reversals more likely than a commitment to new trend
Why the Biggest Dow Rally Since 1933 Isn’t So Impressive
There
is eventually a break in all driving trends, and Tuesday’s rebound from
risk-sensitive assets was no exception. Taking stock of the day’s
bearing, there was a very explicit bid across those battered markets
that tend to track an appetite for higher return at the express
sacrifice of greater safety (in other world’s ‘risk assets’). Nowhere
was the charge more remarkable in my estimation than through the
benchmarks for US equities. The advance was palpable for all the key
measures I follow, but the top performance was put in by the Dow with an
astounding 11.3 percent boom. That is the biggest single-day percentage
rally for the ‘blue chip’ benchmark since 1933, easily outstripping the
9.3 percent S&P 500 rally or the Nasdaq’s
8 percent move. For those that want to read into the disproportionate
move, this could be deemed a more systemic appetite for depressed
speculative favorites, but I believe this is more appropriately a
rudimentary speculative bounce with a little more targeted influence
through unique fundamentals.
Wall StreetBULLISH
Data provided by
of clients are net short.
Change in
Longs
Shorts
OI
Daily
-34%
83%
9%
Weekly
-26%
79%
15%
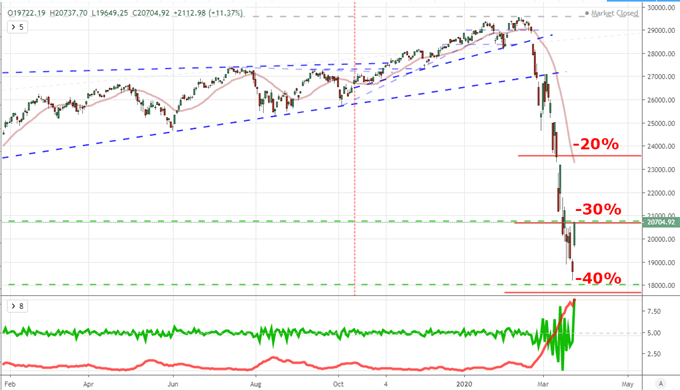
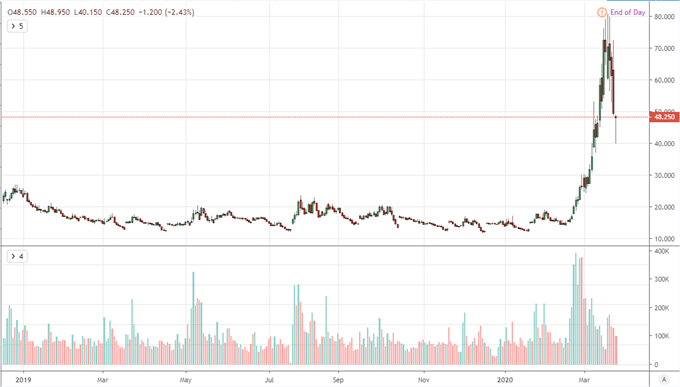
Chart of Dow Jones Industrial Average with 1-Day Rate of Change and 10-Day ATR (Daily)
What
is worth noting about the particular intensity for the Dow is that the
US index has also set the pace with its tumble these past few weeks,
stretching almost to a 40 percent correction from record highs. We
discussed yesterday the disparity in pace leaning towards the tech-heavy
Nasdaq as a possible indication of which industries’ revenues will be
more heavily hit by the economic throttling that results from the
coronavirus fight. The same considerations may hold in explain Tuesday’s
rebound with US President Donald Trump remarking that he ‘would not let
Boeing go out of business.’ The airplane manufacturer has lost its
status as the principal component of the index, but it is still one of
the vaunted 30. Meanwhile, a jump from across the spectrum of
speculative measures I like to refer to still gives an encouraging bolt
of optimism where little enthusiasm has been able to develop. Then
again, a break in the clouds does not always indicate the end of a
storm.
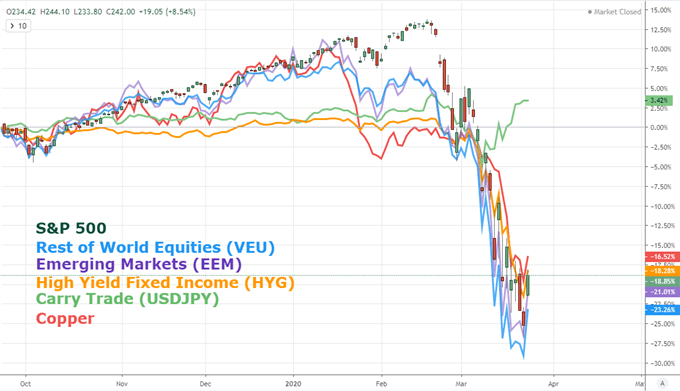
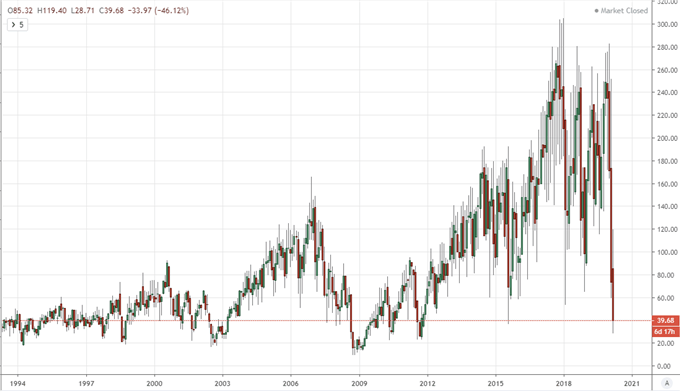
Chart of Relative 6-Month Performance of S&P 500, VEU, EEM, HYG, USDCAD and Copper (Daily)
Chart Created on Tradingview
Beneath it All, Volatility
There
is plenty of fundamental fodder that can be used to cast serious doubt
on any nascent recoveries for the broader market, but my concerns run
more rudimentary lines than the collective doubt surrounding the fight
against the impending global recession. My true misgivings lay with the
level of volatility underlying the market. Elevated activity in the
financial system is a resounding signal of uncertainty. Priced based
volatility – which is pushing post GFC (Great Financial Crisis) highs –
has yet to break its fever, and the check higher actually extends that
troubling trend. Further, the implied (expected) measures of future
indecision through measures like the VIX and its asset-determined
counterparts continue to hold in dangerous territory.
Considered
another way, would the Dow have put in for such an exceptional rally if
the market were not already moving at an exaggerated clip? It is
unlikely. A dramatic decline earns an equally-leveraged correction.
Follow through in a recovery remains a difficult achievement. At its
core, volatility is a reflection of uncertainty and instability. That
does not align well to a sense of confidence that is necessary to draw
funds back into the market ready to weather the fundamental uncertainty
that lies ahead. More likely, any sign of fresh trouble – or even a
shortfall in curbing the pain in principal fears – will send market
participants back into a tailspin of despondency.
Chart of the S&P 500 Relative to the VIX Volatility Index (Monthly)
While
the turbulence of sentiment in a complex financial system is my primary
concern, that doesn’t mean we are operating without a fundamental
guidance. On the favorable side of the coin, optimism gathers around a
historic global response by policy officials to stabilize the economy
and markets. The list of stimulus efforts around the world has grown
very long indeed, but the Federal Reserve’s move into purchasing a wider
list of debt represents a likely plateau of capacity. Central banks
have not been the group slow to respond however. That honor goes to the
world’s governments. Stimulus programs from Japan and throughout Europe
have attempted to establish a mooring, but the United States is the
yardstick; and thus far, the touted $2 trillion stimulus program that is
meant as a key component has yet to receive Congressional approval.
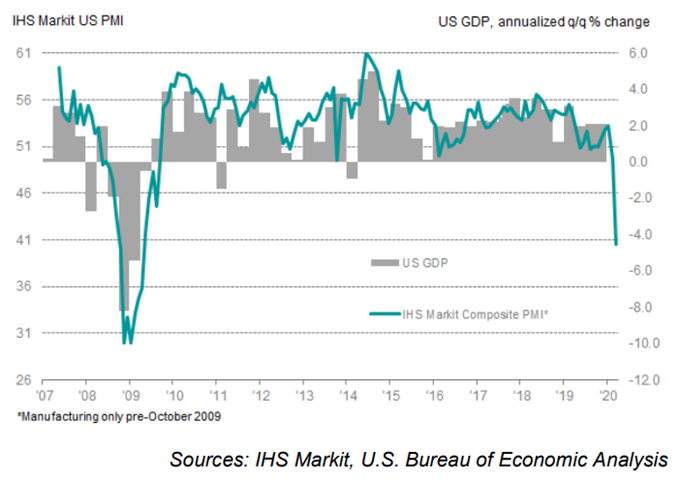
As
the government response is debated, leading data is starting to offer a
glimpse of just how troubled the forecast is looking. Tuesday’s theme
on the economic docket was economic tempo established in the March PMIs
for Australia, Japan, the Eurozone, France, Germany, the UK and the US.
They were all miserable figures in historical terms, but the US data
again stands out thanks to the country’s larger scale. A recession
awaits the world and its largest component; so a plan that does not
account for that scale of pressure may prove a doomed effort. The
question we are evaluating for the immediate future though is whether
speculative assumption has already raised the bar for US action to a
point where it is impossible to live up to expectations?
Recommended by John Kicklighter
Building Confidence in Trading
Get My Guide
Chart US Composite PMI from Markit with US GDP (Monthly)
Chart from IHS Markit with Additional Data from the BEA

 按圖放大周二市場風險偏好情緒回歸,儘管經濟數據表現不佳,且新興冠狀病毒病例激增,但道瓊斯指數仍然錄得自1933年以來的最大單日漲幅。不過衡量市場恐慌情緒的波動率指數繼續下降,在收於61之前曾一度跌至36。雖然美元/日元的上漲表面上可能預示着市場情緒良好,但波動率指數日內大幅走低暗示,劇烈波動的局面尚未結束——道瓊斯指數創紀錄的上漲進一步證明了這一前景。2020年頂級交易機會&2019交易教訓一鍵獲取
 按圖放大另一方面,若風險偏好情緒得以保持,則美元/日元上方阻力位關注112,上破該水平則意味着多頭有進一步推進的意願,因此若日線收於112.22則將是一個令人備受鼓舞的技術走勢。雖然最近的價格走勢和美元/日元的拋物線式反彈表明市場情緒已經完全恢復,但筆者並不認為道瓊斯指數和DAX
30指數等風險資產也會出現類似的反彈。外匯市場基本面和技術面雙管齊下,就在Dailyfx免費交易指南
按圖放大另一方面,若風險偏好情緒得以保持,則美元/日元上方阻力位關注112,上破該水平則意味着多頭有進一步推進的意願,因此若日線收於112.22則將是一個令人備受鼓舞的技術走勢。雖然最近的價格走勢和美元/日元的拋物線式反彈表明市場情緒已經完全恢復,但筆者並不認為道瓊斯指數和DAX
30指數等風險資產也會出現類似的反彈。外匯市場基本面和技術面雙管齊下,就在Dailyfx免費交易指南

No comments:
Post a Comment